Development Error Console
by bob@jetzig.dev
2024-11-24
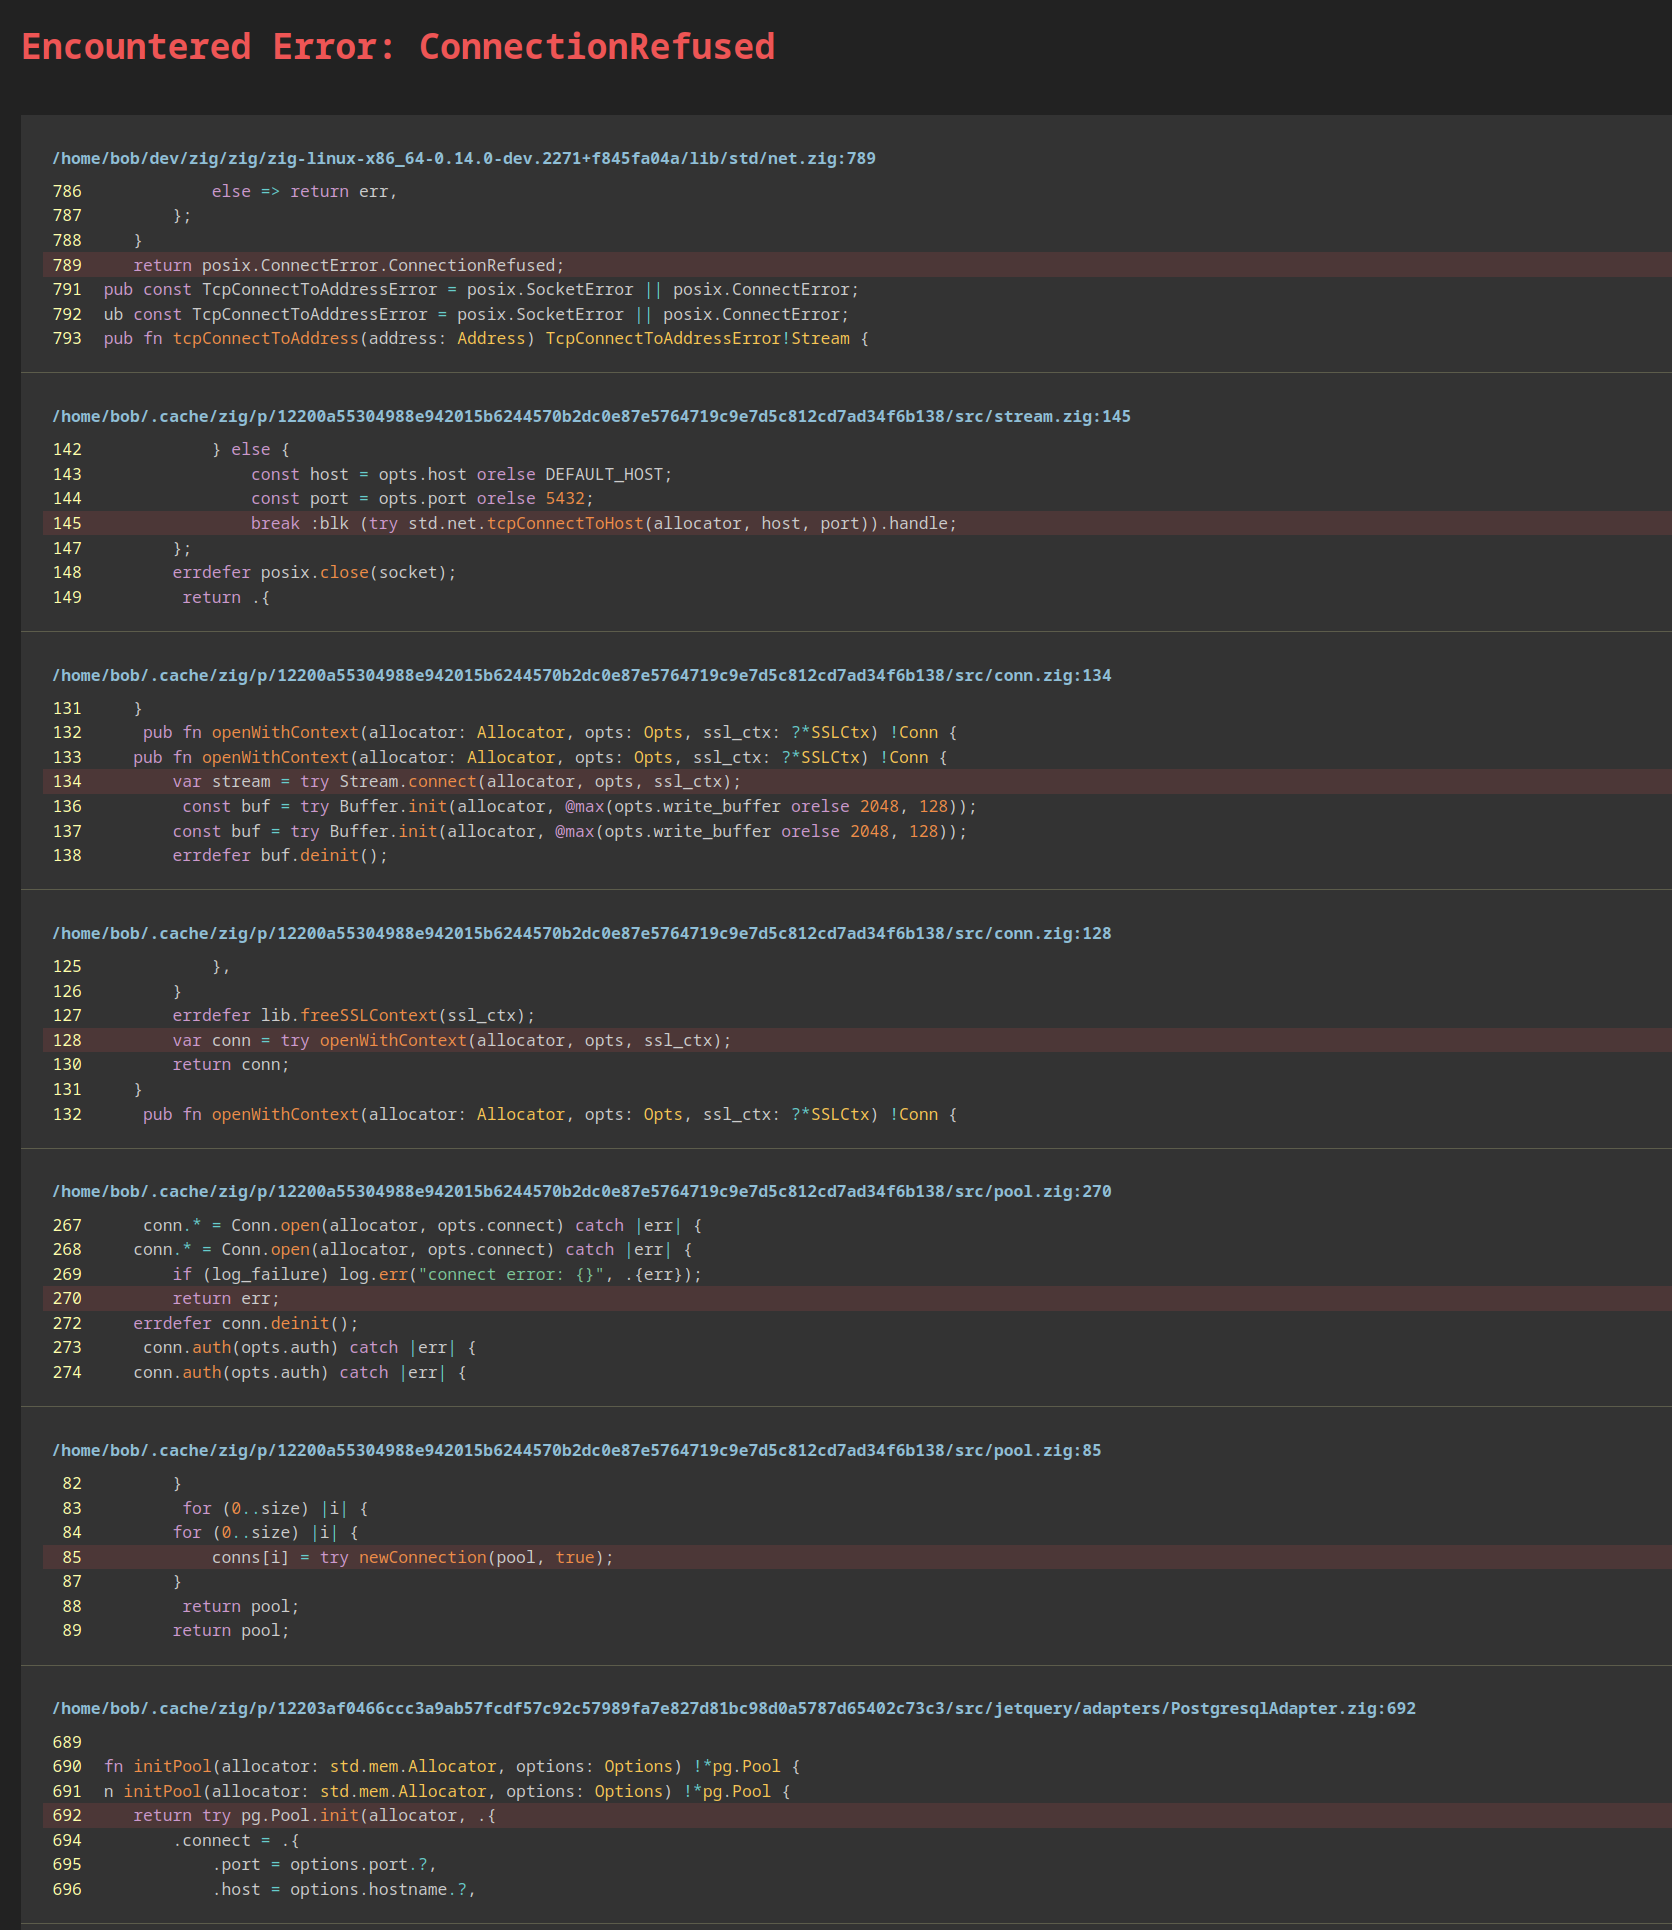
Jetzig now provides a development-mode error debug console.
To use the console, simply run the latest version of the Jetzig CLI with the server command:
jetzig serverAlternatively, pass the debug_console option explicitly to zig build:
zig build -Ddebug_console=true runThe debug console is only available when the following criteria are met:
- Jetzig environment is set to development
- -Ddebug_console=true is passed to zig build (done automatically by jetzig server)
- Zig's optimization mode is Debug or ReleaseSafe
Backtrace
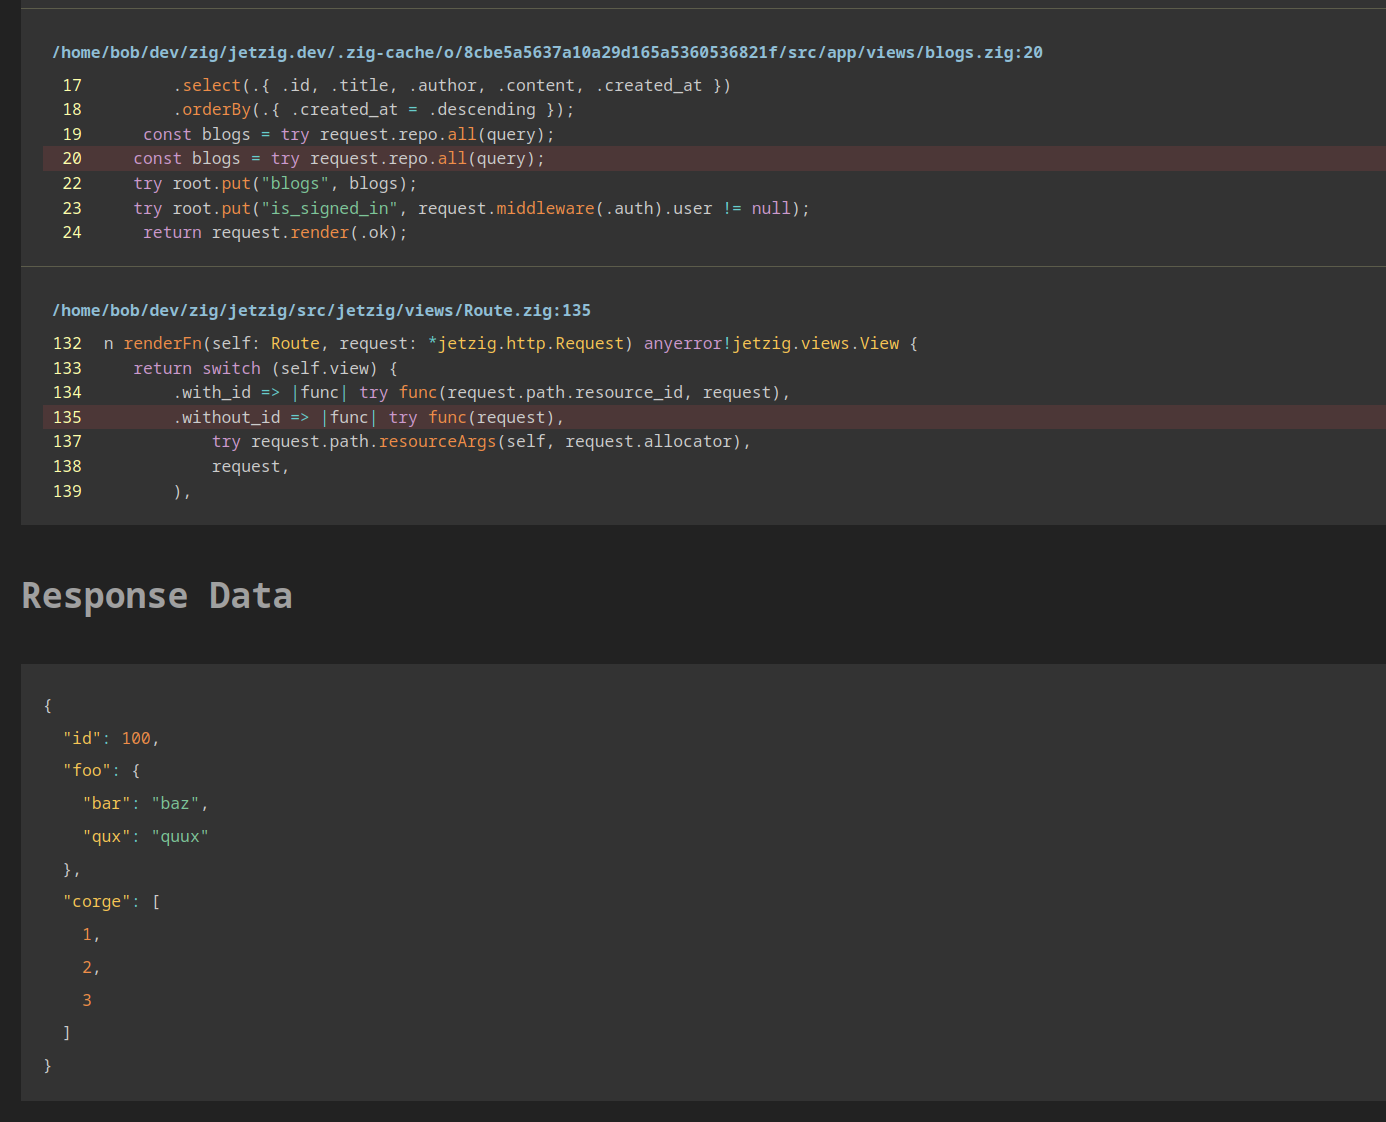
All available backtrace frames are rendered with source code syntax highlighting in context with surrounding lines.

Response Data
Response data represented as JSON, pretty-printed with syntax highlighting.

Zmpl Errors
Although not yet integrated with Jetzig's debug console, Zmpl now generates debug tokens in compiled templates when running in debug mode, mapping errors back to the template that generated them.

Comments
Angelita
You definitely made your point!
casino en ligne francais
Seriously quite a lot of terrific material!
casino en ligne
Seriously many of excellent information!
casino en ligne
You actually mentioned it really well.
meilleur casino en ligne
Awesome facts, Regards!
casino en ligne
Nicely put. Regards!
casino en ligne fiable
Truly a good deal of terrific tips.
casino en ligne fiable
Information well applied..
casino en ligne fiable
Fantastic facts, Thank you!
casino en ligne
Very well spoken indeed! .
casino en ligne
Zack
I do believe this is a mighty fine looking blog post If I do say so.